
The short answer
- London has about 1,450 independent yoga, pilates and dance studios I could find on Google Maps. That's 1.6 per 10,000 residents, or one for every 6,300 people.
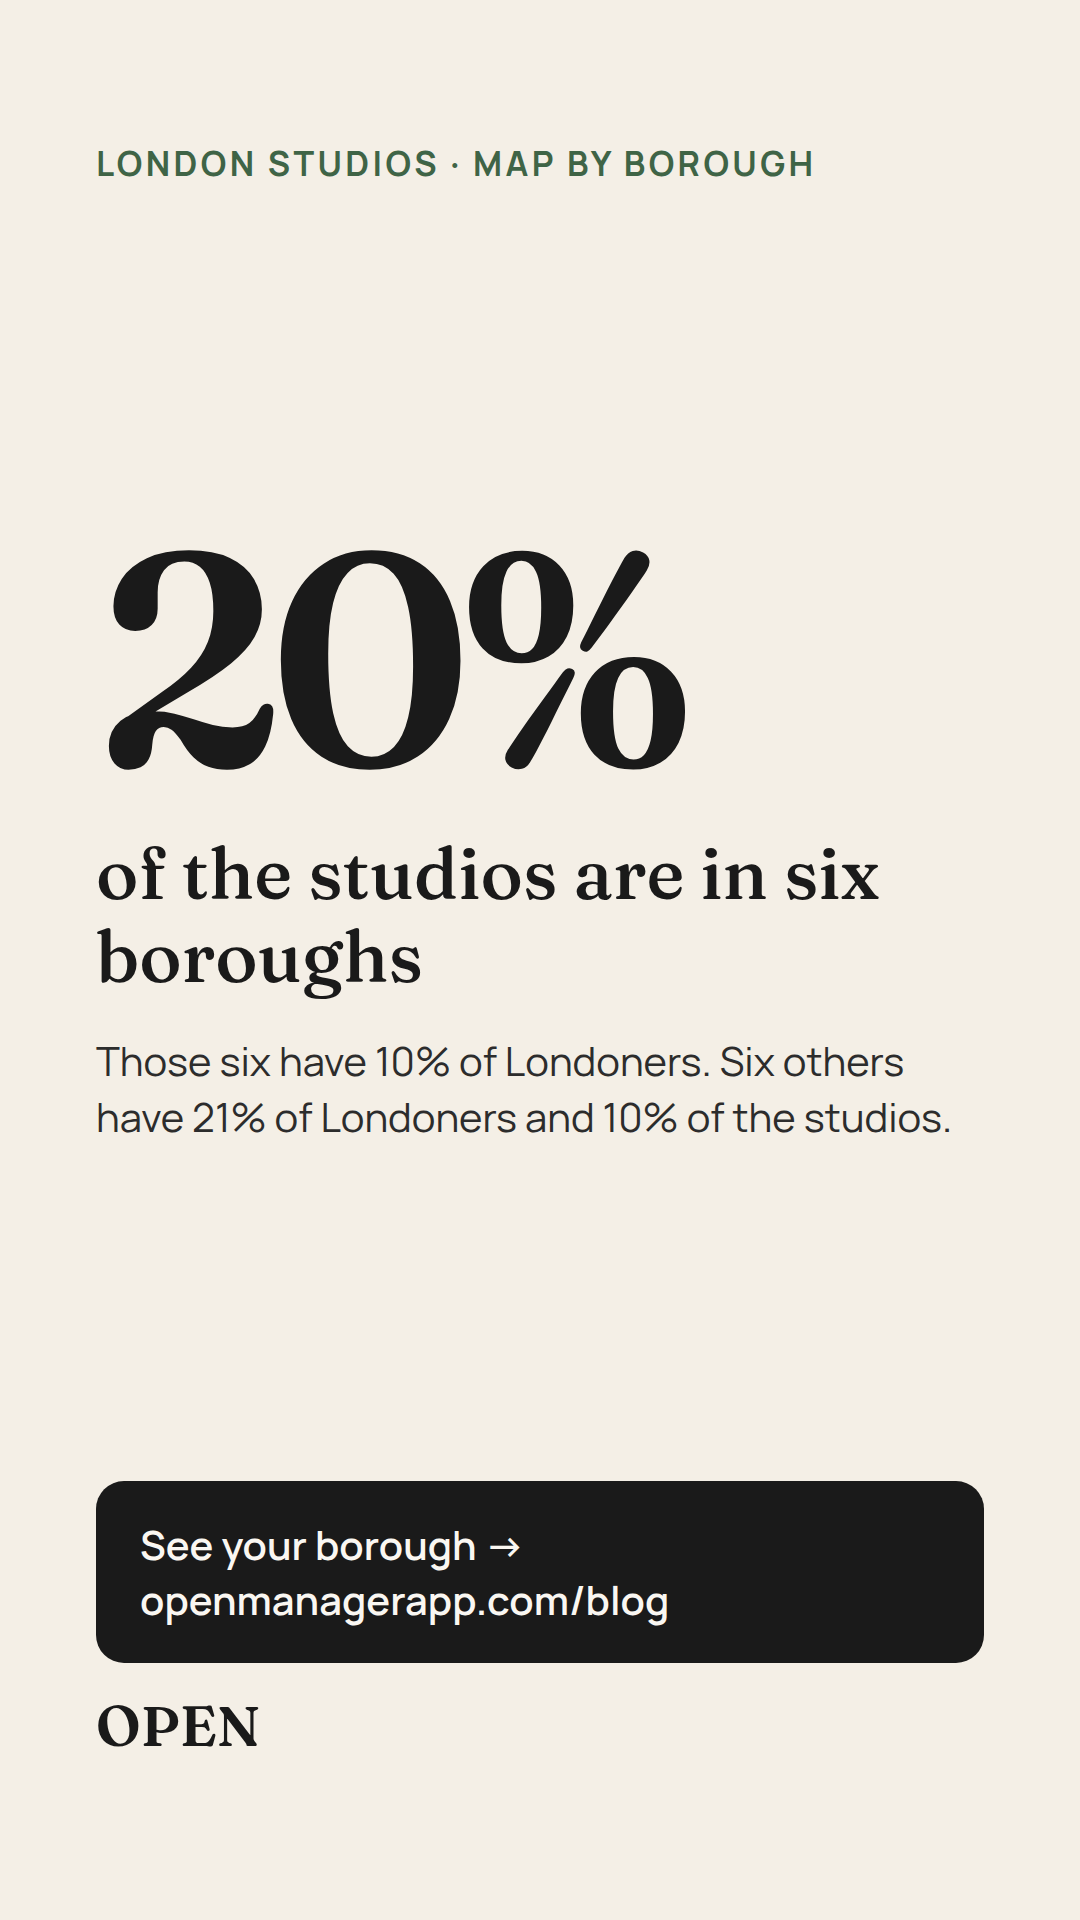
- Six boroughs with 10% of Londoners have 20% of the studios. Richmond upon Thames (3.5) and Islington (3.2) lead among the boroughs where most people actually live.
- Six boroughs with 21% of Londoners have 10%. In Barking and Dagenham there's one studio for every 18,300 residents.
- Pilates is 47% of the studios in Lewisham and 12% in Hounslow. In Bexley, six in ten are dance schools.
Studios: Google Maps listings on 29 October 2026, chains and gyms removed. Residents: ONS mid-2025 estimates. How I worked it out is at the end.
In this article
I'm Nik and I make OPEN, booking and payment software for studios. I wanted to understand how many studios London really has and where they are. OPEN has no UK studios yet, so this isn't our data. It's what anyone could count from public listings, if they had the patience.
No studio is named here, and none is called good or bad. Only the totals count.
How many studios each London borough has
A plain count flatters big boroughs. Bromley has the most studios in London, 82, but it also has 336,000 residents. So I count per 10,000 residents. The London figure is 1.6.
| Borough | Studios | Per 10,000 residents | Yoga | Pilates | Dance |
|---|---|---|---|---|---|
| City of London | 14 | 9.0 | 14% | 43% | 36% |
| Richmond upon Thames | 69 | 3.5 | 25% | 36% | 39% |
| Islington | 72 | 3.2 | 38% | 28% | 31% |
| Kensington and Chelsea | 42 | 2.9 | 29% | 40% | 31% |
| Kingston upon Thames | 47 | 2.7 | 30% | 36% | 30% |
| Hammersmith and Fulham | 50 | 2.6 | 34% | 32% | 30% |
| Bromley | 82 | 2.4 | 29% | 38% | 28% |
| Camden | 52 | 2.4 | 35% | 23% | 40% |
| Westminster | 46 | 2.2 | 24% | 28% | 39% |
| Hackney | 57 | 2.1 | 46% | 42% | 12% |
| Merton | 46 | 2.1 | 26% | 39% | 33% |
| Harrow | 50 | 1.8 | 50% | 18% | 28% |
| Lambeth | 57 | 1.8 | 44% | 23% | 30% |
| Wandsworth | 61 | 1.8 | 31% | 41% | 21% |
| Sutton | 37 | 1.7 | 30% | 30% | 38% |
| Barnet | 70 | 1.7 | 36% | 36% | 27% |
| Havering | 45 | 1.6 | 33% | 13% | 47% |
| Tower Hamlets | 53 | 1.6 | 40% | 28% | 23% |
| Haringey | 42 | 1.6 | 31% | 36% | 29% |
| Enfield | 46 | 1.4 | 22% | 37% | 37% |
| Ealing | 52 | 1.3 | 42% | 15% | 40% |
| Croydon | 52 | 1.3 | 25% | 31% | 40% |
| Hillingdon | 38 | 1.2 | 24% | 32% | 45% |
| Waltham Forest | 33 | 1.2 | 52% | 15% | 30% |
| Bexley | 29 | 1.1 | 21% | 14% | 62% |
| Southwark | 35 | 1.1 | 34% | 31% | 31% |
| Lewisham | 32 | 1.1 | 12% | 47% | 41% |
| Greenwich | 29 | 1.0 | 24% | 31% | 41% |
| Hounslow | 25 | 0.8 | 44% | 12% | 40% |
| Redbridge | 26 | 0.8 | 23% | 38% | 38% |
| Brent | 24 | 0.7 | 29% | 25% | 42% |
| Newham | 24 | 0.6 | 33% | 33% | 33% |
| Barking and Dagenham | 13 | 0.5 | 23% | 15% | 54% |
| London | 1,450 | 1.6 | 32% | 31% | 34% |
Where studios are thick on the ground
Ignore the City of London at the top of the table. About 15,600 people live there and many more work there, so 9.0 tells you about office workers, not residents.
After that the list is more interesting than "the centre". Richmond upon Thames and Kingston upon Thames are both outer boroughs, and Richmond has more studios per resident than Islington, Camden or Westminster. Bromley, on the south-eastern edge, has the highest count in London. Inner London as a whole has 1.8 studios per 10,000 residents and outer London 1.4, which is a smaller gap than I expected.
Lots of studios doesn't mean there's no room for another. It also means people there already pay for classes. But you'd be competing on timetable, teachers and price from the first week.
Where there are few
Barking and Dagenham, Newham, Brent, Redbridge, Hounslow and Greenwich have 21% of London's residents and 10% of its studios.
Few studios can be an opening, or a sign of less demand. From a list of addresses I can't tell which, and I won't guess.
Southwark surprised me most. It sits next to the centre, with 312,000 residents and 1.1 studios per 10,000, about a third of Islington's figure.
Where pilates, yoga and dance lead
Across London it's close to an even split: 32% yoga, 31% pilates, 34% dance. Borough by borough it's anything but.
- Pilates is strongest in Lewisham (47%), Hackney (42%), Wandsworth (41%) and Kensington and Chelsea (40%). It's weakest in Hounslow (12%), Havering (13%), Bexley (14%), Ealing and Waltham Forest (15% each).
- Yoga leads in Waltham Forest (52%), Harrow (50%), Hackney (46%) and Lambeth and Hounslow (44% each).
- Dance leads on the edges: Bexley (62%), Barking and Dagenham (54%), Havering (47%) and Hillingdon (45%). Hackney is the outlier the other way, at 12%, with yoga and pilates taking nearly all of it.
If you're opening a studio, this matters more than the total. A yoga studio in Lewisham has less direct competition than the table suggests. A pilates studio in Lewisham has more.
What to check before you pick premises
The map helps you rule an area out, or decide where to go and look. It doesn't make the decision.
- Count the studios within a ten-minute walk of the premises, especially ones like yours. A pilates studio next to a dance school isn't the same competition as two pilates studios.
- Stand on the street on a weekday at 6 pm. See who's walking past and how they get there.
- Look at who lives there. The ONS publishes population by age for every borough, free.
- Read how the studios nearby take bookings. I went through about 2,000 UK studio websites for how UK studios take bookings.
- Add up what you'll pay for software before you sign up for any of it: what a UK studio pays for software.
How I worked it out
- Studios. Google Maps listings on 29 October 2026, from six searches (yoga studio, pilates studio, reformer pilates, barre, dance school, dance studio) in each of the 33 boroughs. Only operating, independent studios count: no chains or franchises (more than five sites), gyms, physios and clinics, council leisure centres, schools and colleges, and no listings with no website and under 15 reviews. A studio with several sites counts once per site.
- Treat the numbers as a minimum. Google returns at most 60 results per search and area, so a busy borough can lose a few, and a teacher who rents a hall by the hour usually has no listing at all. The figures compare boroughs well, but they aren't a census.
- Type of studio. Each is classed as yoga, pilates, dance or mixed from its name and Google category. Barre sits with pilates.
- Boroughs. From each studio's postcode, through postcodes.io. A handful of listings just outside the boundary are left out.
- Residents. ONS mid-year population estimates for mid-2025, Open Government Licence. Residents only, so boroughs where many people work look thinner or busier than daily life suggests.
- Inner and outer London use the ONS definition.
- Map. Boundaries from the ONS Open Geography Portal (Local Authority Districts, May 2025), Open Government Licence, contains OS data © Crown copyright and database right. Each dot is the point on the studio's public listing.
- Every figure combines at least five studios. No studio is named.
Get the next article
One a month, for people who run a studio. No ads.
I make OPEN, booking and payment software for studios. If you're thinking about where to open and want to talk it through, book half an hour with me.